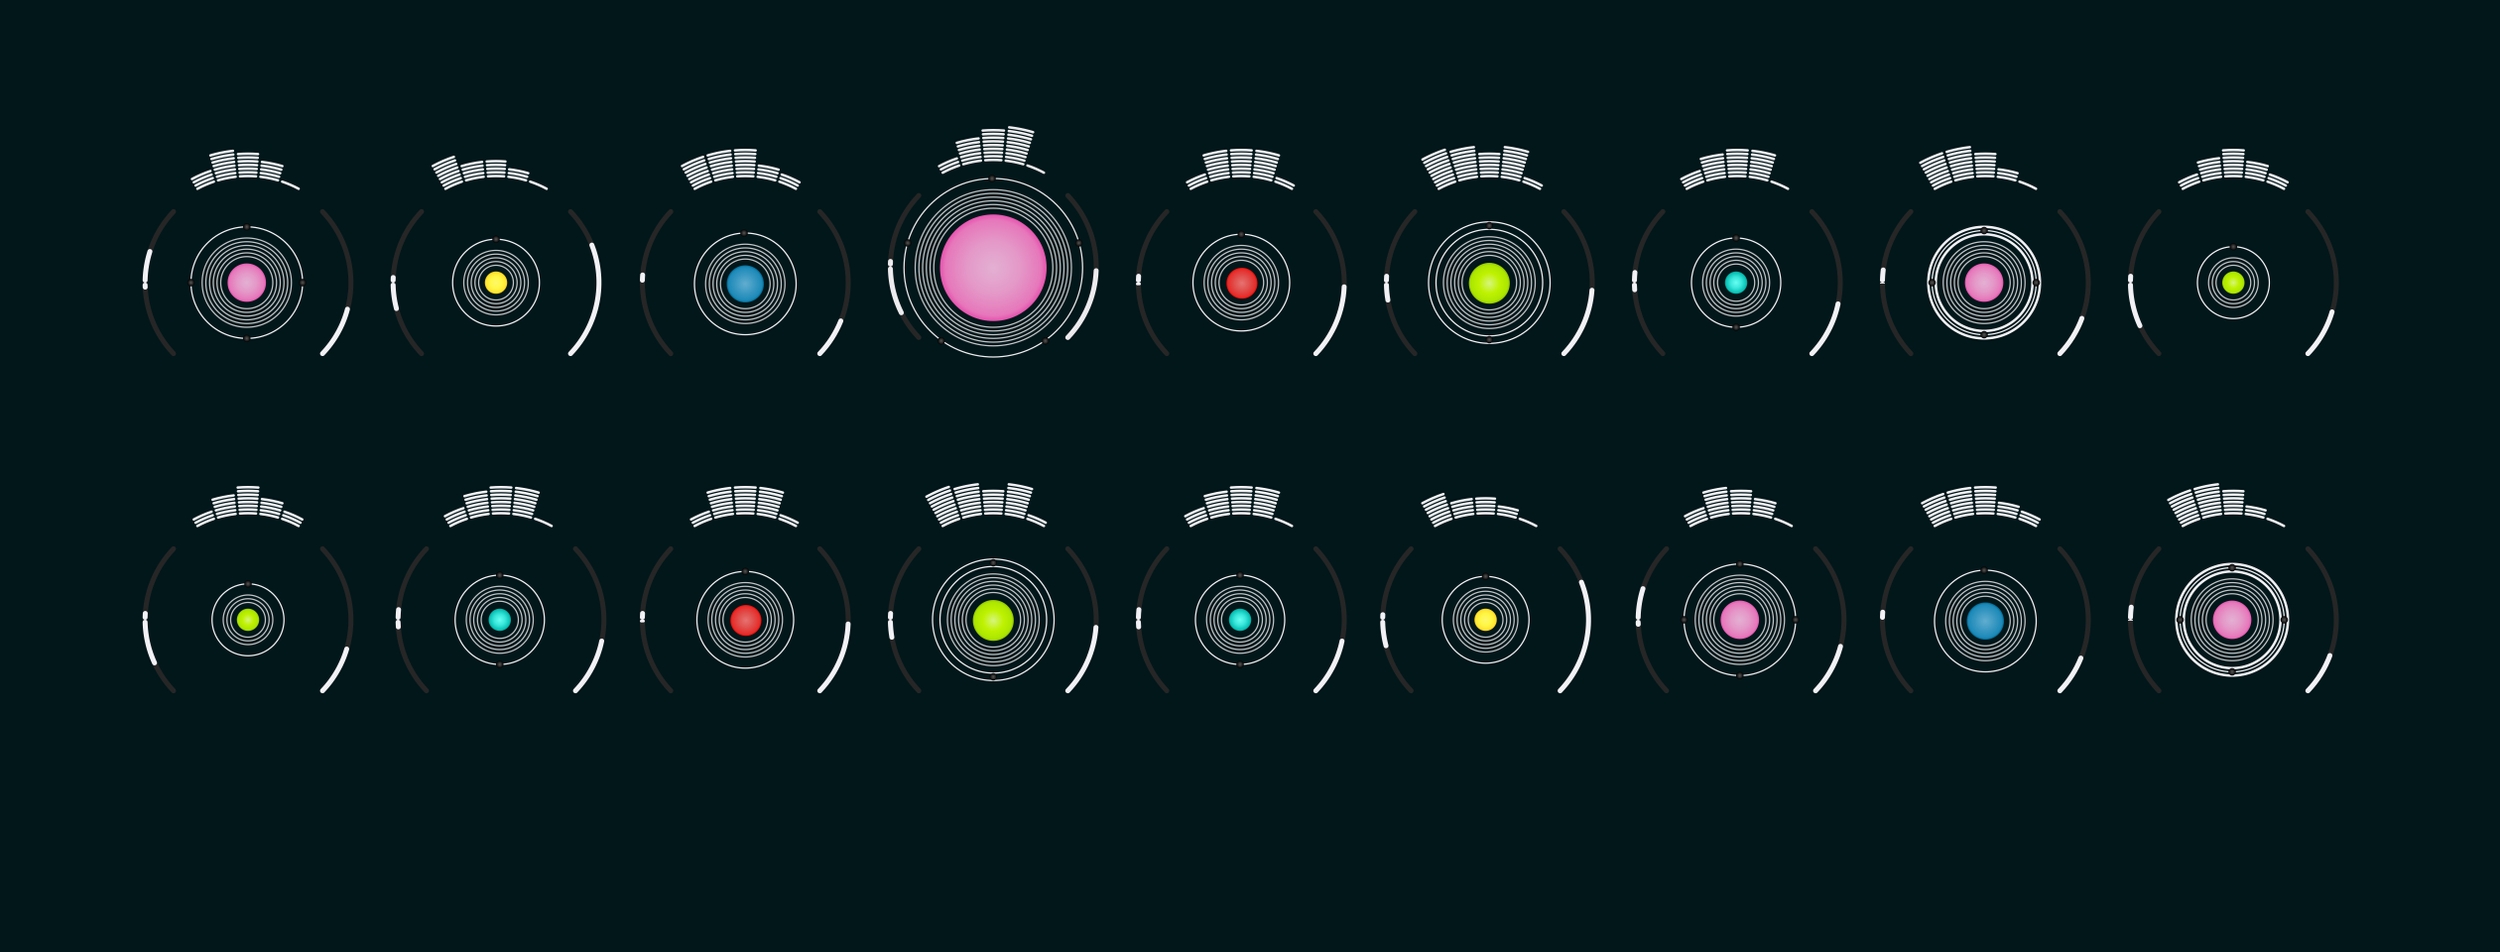
Why is Data Visualization such a powerful tool?
Let's face it. Humans are not very good at extracting meaning from rows and rows of data, even when they contain real gems.
We are highly visual beings. Show us a well-crafted visualization, and we grasp the big picture in a heartbeat.
Effective visual communication makes us feel emotionally connected to the reality presented. Data Visualization is a tool of choice to raise awareness, broaden perspectives, and reveal hidden stories.
And this is how we generate engagement.
Sounds interesting! But where can we use Data Visualizations?
When thinking about Data Visualizations, the first images that come to my mind are the stunning graphics in National Geographic articles. But when it comes to where we can use visualizations, the sky is the limit! Data visualization support options are endless: from physical installations to fashion to postcards (take a look here if you are wondering what I mean by postcards).
The two main supports for Creative Data Visualizations are Digital and Print. We often use them for expository visualizations, which have a fixed dataset. Occasionally, creative digital visualizations will have an ever-evolving stream of data and will be exploratory.
Digital supports
Web pages or applications are the support of choice to explore a subject in depth. Thanks to carefully crafted interactions, the user can reveal information, zoom in on a specific section, or even hear music.
Printed publications
Unique visualizations add depth and context to any article, supporting the text's conclusions. They create engagement and raise awareness on posters and pamphlets or impress stakeholders on reports.
Attention to details & Enthusiasm
What is it like to work with me?
My engineering, design, front-end development, and project management backgrounds allow me to tackle projects from raw data to full-fledged digital or printed visualization. I also enjoy jumping in for a specific project stage, whether it is data analysis, design, or development. I mostly work on my own, but I’m always happy to be part of a broader team or lead collaborators from different disciplines toward creating an outstanding experience.
My signature is an obsession for these little details that make a project rise WAY beyond average. With my enthusiasm, UX considerations, and unique designs, I aim to create a memorable experience for the end-user AND my collaborators.
Learn more about meI had the chance to work with Anne-Marie in my team for many years. She has multiple qualities, combining empathy, energy, creativity, and professionalism. She is ready to face challenges outside of her comfort zone, and, on top of that, she delivers outstanding quality. I can only recommend her services to myself and around me.
